

Java Performance Profiling Using Flame Graphs
JDK 有很多性能测量工具 JConsole、VisualVM、HPROF 等。它们中的大多数将应用程序作为一个整体进行分析,并且需要一些繁琐的分析过程能到分析出类或方法级别的热点。
当我试图评估我们的一个服务的性能时,可以通过 CPU 火焰图的方法,它在找出代码的 CPU 使用率方面非常有效。
这篇文章记录了我在对投递服务进行基准测试时发现的性能问题,以及通过 CPU 火焰图找到热点方法并改进的调优过程。
要求
- 如果你使用 IntelliJ IDEA Ultimate ,那么这个 IDE 自带一个火焰图工具 Async Profiler
- 如果你要在生产环境生成火焰图,你可以借助这个工具 火焰图生成工具 async-profiler
场景
这一切源于一个基准测试。通常我们在交付一个产品前需要对这个服务进行基准测试。并通过基准测试结果得出在某些硬件基准下我们服务的性能指标,最终通过这些指标你可以回答用户提出的容量要求。
投递服务: 这个服务负责从客户端接收消息,放入待发送队列,并持久化到数据库中。然后立即返回给客户端。为了准确额模拟客户端我为此编写了一个基准测试客户端程序。
经过多轮基准测试,我们找到单机服务下了吞吐率最佳的参数,并得到了最佳吞吐率 QPS 769
- 总计发送 10000 笔业务
- 50 并发;
Welcome to the Notifier CLI 4.8.0

Type 'help' for help.

notifier>benchmark -T 123123 -n 10000 -c 50 -w 10
Benchmarking ░░░░░░░░░░░░░░░░░░░░░░░░░░░░░░░░░░░░░░░░░░░░░░░░░░░░░░░░░░░░░░░░░░░░░░░░░░░░░░░░░░░░░░░░░░░░░░░░░░░░░░░░░░░░░░░░░░░░░░░░░░░░░░░░░░░░░░░░░░░░░░░░░░░░░░░░░░░░░░░░░░░

Warm Up                   10
Concurrency Level         50
Time taken for tests      13 seconds
Complete requests         10000
Failed requests           5000
Refused requests          0
Requests per second       769 [#/sec]
Time per request          67 [ms]

Percentage of the requests served within a certain time (ms)
50%   46.32
60%   46.46
70%   44.75
80%   41.13
90%   36.82
100%  33.14
Done.
notifier>
因为我们的客户端和服务端通过 GRPC 协议进行通信,并且服务端只做消息入队列和持久化到数据库,理论上 QPS 至少应该达到 1000
分析 (IntelliJ IDEA Ultimate)
因为在 IntelliJ IDEA Ultimate 中生成火焰图比较方便,所以我直接使用 Async Profiler 插件,重做一次基准测试并生成如下火焰图
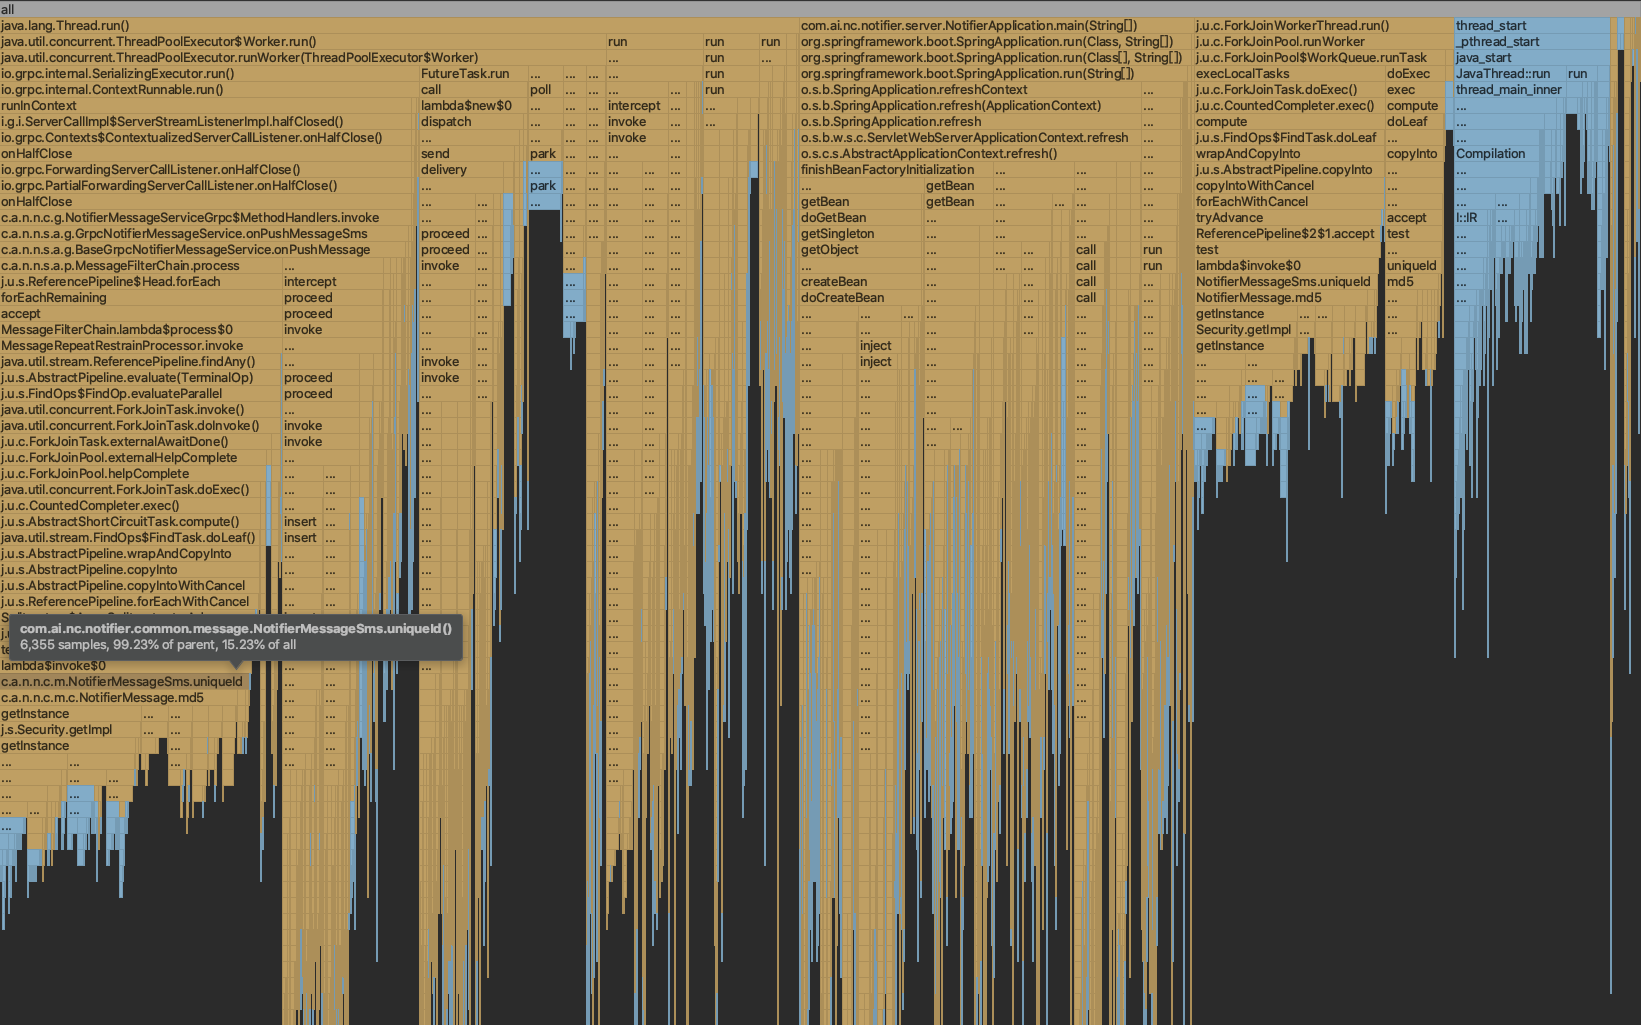
火焰图的 X 轴记录了整体消耗的时间,你可以发现 NotifierMessage.uniqueId() 方法消耗了总时间的 15.23 %
找到对应代码,发现这个方法使用了 MD5 生成消息的唯一标识
@Override
public String uniqueId() {
  String value = content + smsTo + sourceAddrSuffix;
  return md5(value);
}

protected String md5(String value) {
  try {
    MessageDigest md = MessageDigest.getInstance("MD5");
    md.update(value.getBytes());
    byte[] digest = md.digest();
    return DatatypeConverter.printHexBinary(digest).toUpperCase();
  } catch (Exception ex) {
    throw new RuntimeException("MD5失败", ex);
  }
}
优化
众所周知 MD5 是安全性较高的摘要算法,但是极限测试时性能问题比较突出,因为我们从业务上生成这个唯一ID,只是为了做短期(1分钟之内)的消息重复判定,所以我们可以改为 CRC32 摘要算法(我用 JMH 简单做了 CRC32 和 MD5 的基准测试 ,发现 CRC32 性能高很多)
@Override
public String uniqueId() {
  String value = content + smsTo + sourceAddrSuffix;
  return checksum(value);
}

protected String checksum(String value) {
  Checksum crc32 = new CRC32();
  crc32.update(value.getBytes(), 0, value.getBytes().length);
  return String.valueOf(crc32.getValue());
}
修改完毕后我们重新做基准测试,可以看到吞吐率提升到 QPS 1428,相比于优化前提升了 100%
Welcome to the Notifier CLI 4.1.0

Type 'help' for help.

notifier>benchmark -T 123123 -n 10000 -c 50 -w 10
Benchmarking ░░░░░░░░░░░░░░░░░░░░░░░░░░░░░░░░░░░░░░░░░░░░░░░░░░░░░░░░░░░░░░░░░░░░░░░░░░░░░░░░░░░░░░░░░░░░░░░░░░░░░░░░░░░░░░░░░░░░░░░░░░░░░░░░░░░░░░░░░░░░░░░░░░░░░░░░░░░░░░░░░░░░░░░░░░░░░░░░░░░░░░░░░░░░░░░░░░░░░░░░░░░

Warm Up                   10
Concurrency Level         50
Time taken for tests      7 seconds
Complete requests         10000
Failed requests           5000
Refused requests          0
Requests per second       1428 [#/sec]
Time per request          38 [ms]

Percentage of the requests served within a certain time (ms)
50%   19.41
60%   18.19
70%   16.48
80%   14.81
90%   13.25
100%  11.93
Done.
notifier>
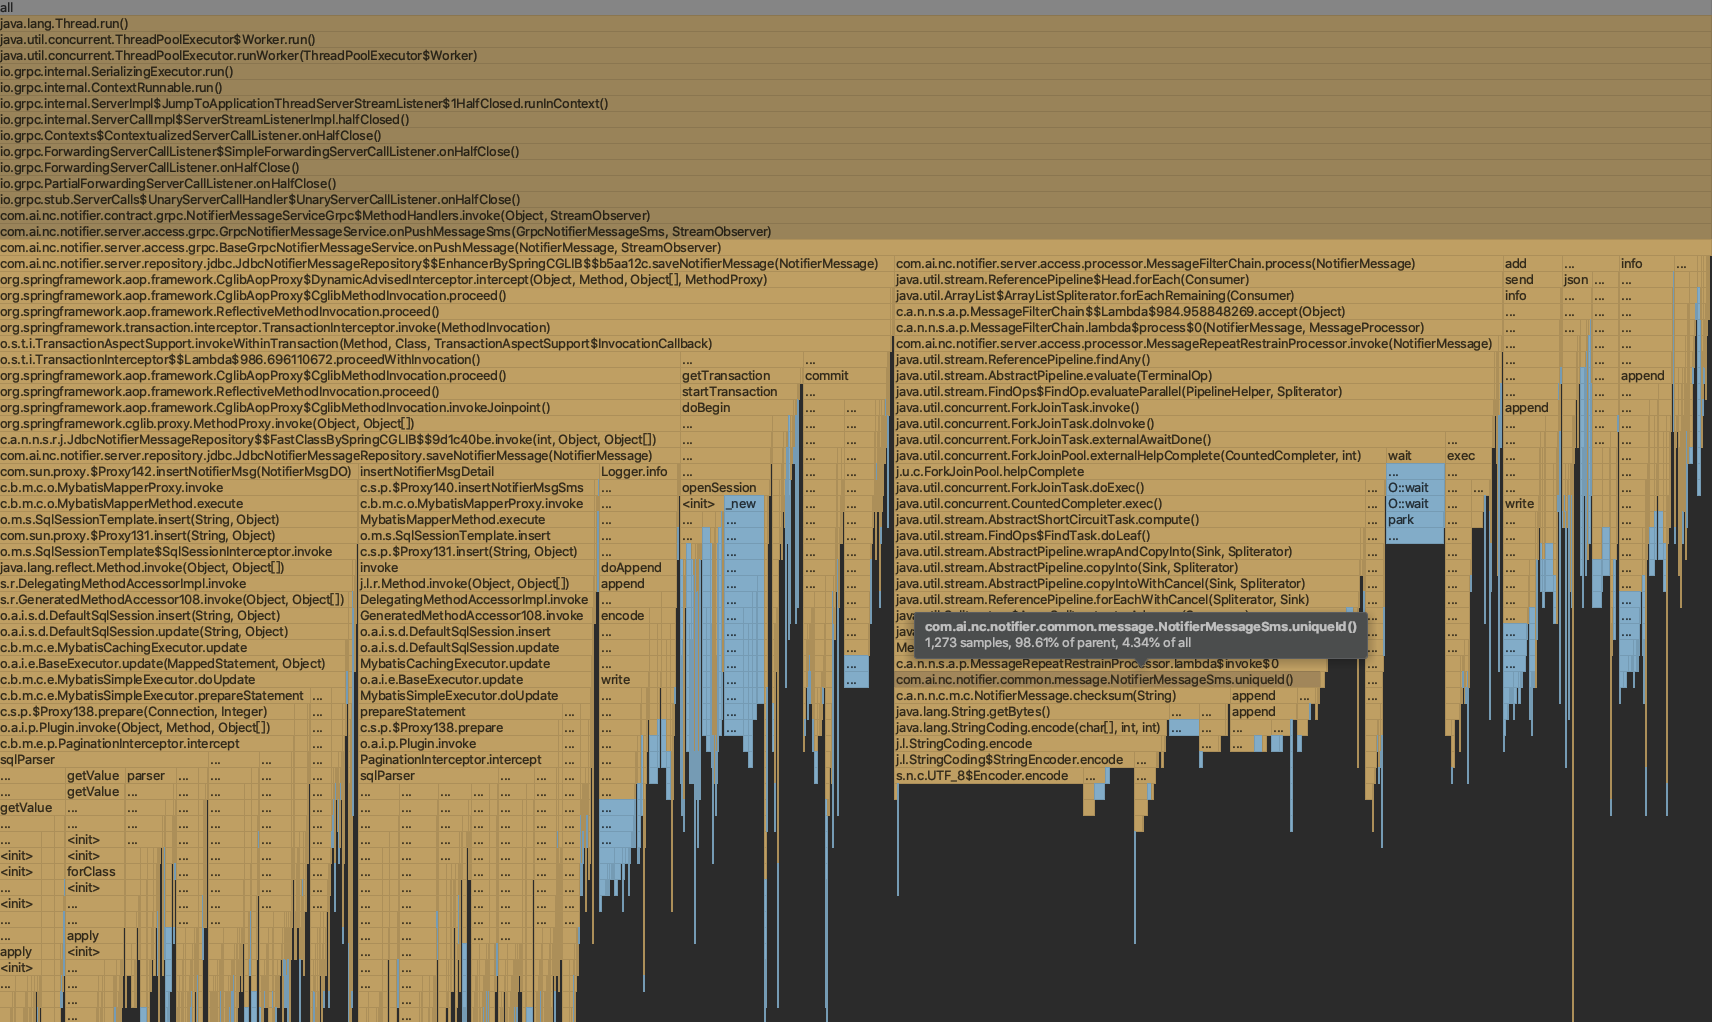
优化后的火焰图可以看到,处理 10000 比请求中 NotifierMessage.uniqueId() 方法的总耗时从 15.23% 下降到了 4.34%
在服务器上生成火焰图
你可以直接下载 Async Profiler 工具,抓取服务器上对应 PID 的服务火焰图
例如:监控 PID 进程 30 秒,并生成火焰图文件 cpu.html
./profiler.sh -d 30 -f cpu.html <pid>
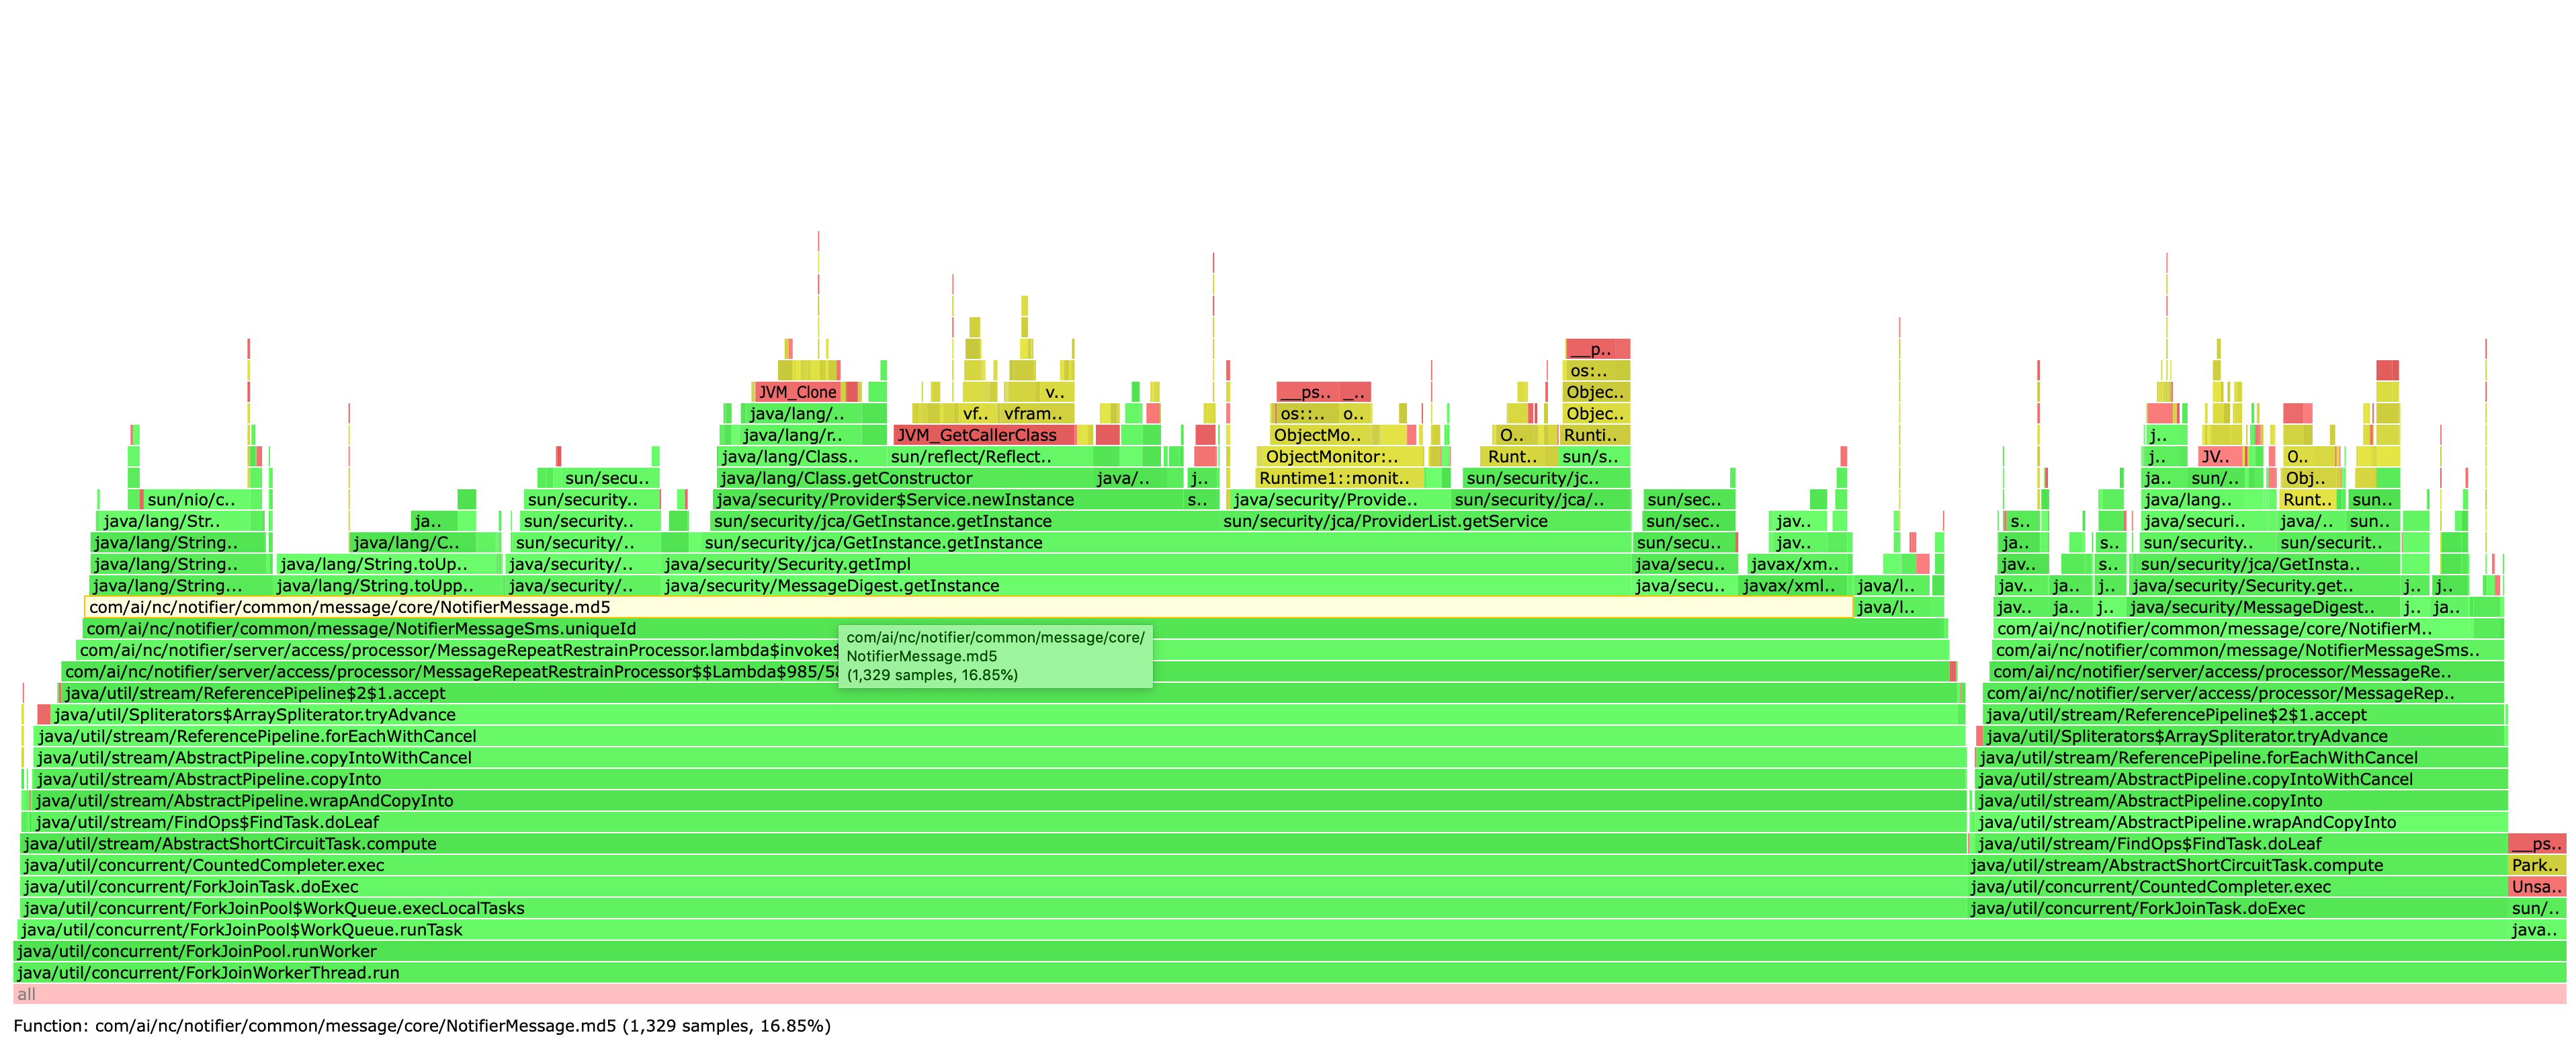
- 绿⾊:代表java执⾏的代码 (主要)
- 黄色:代表 C/C++ ⼀类的 Native 代码, 包括编译器 GC 执⾏ (次要)
- 红色:代表系统调⽤层, 或是未知的执⾏代码段